Prologue — The Quiet Before the Spike
It was just another Tuesday morning when the alerts whispered that one of our Java services had doubled its memory overnight. I shrugged it off: traffic was climbing for the upcoming sale, so maybe the surge was natural. Besides, my dashboard still showed a comfortable 4 GiB limit. What could go wrong?
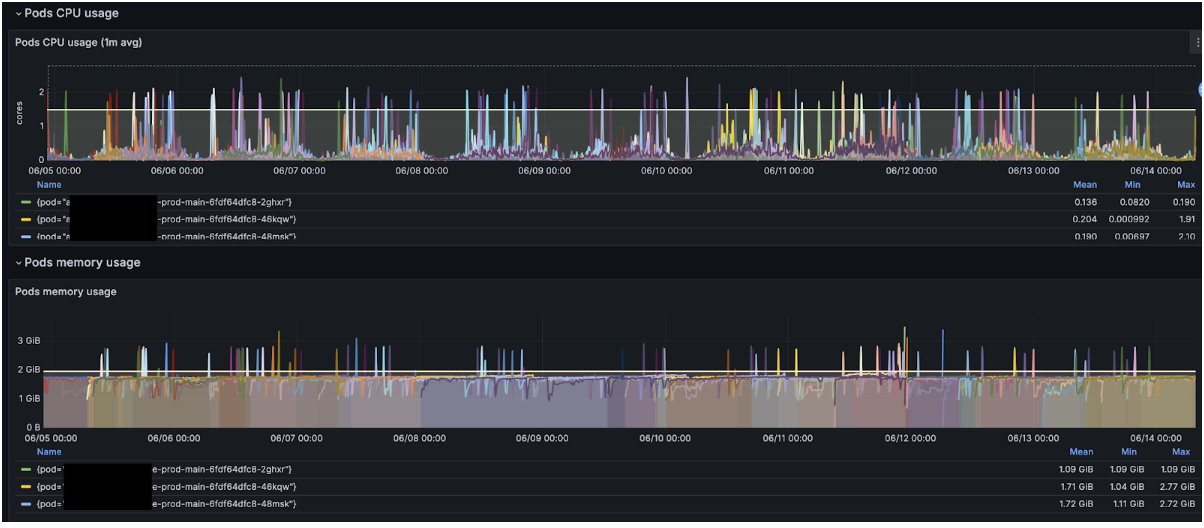
Screenshot 1: Prometheus graph of steady 2 GiB RSS before the incident
Day 1 — A Tiny Tweak With Big Consequences
Over coffee, I remembered a neat JVM trick: "Let the heap size adjust automatically based on container resources." So I added:
-XX:+UseContainerSupport

-XX:MaxRAMPercentage=75.0

-XX:InitialRAMPercentage=50.0
and redeployed, trusting the JVM to read my Kubernetes requests. Thirty minutes later, Grafana lit up like a Christmas tree. Memory at 4 GiB… 6 GiB… 48 GiB.
"Relax," I told myself. "It's sale traffic."
Spoiler: it wasn't.
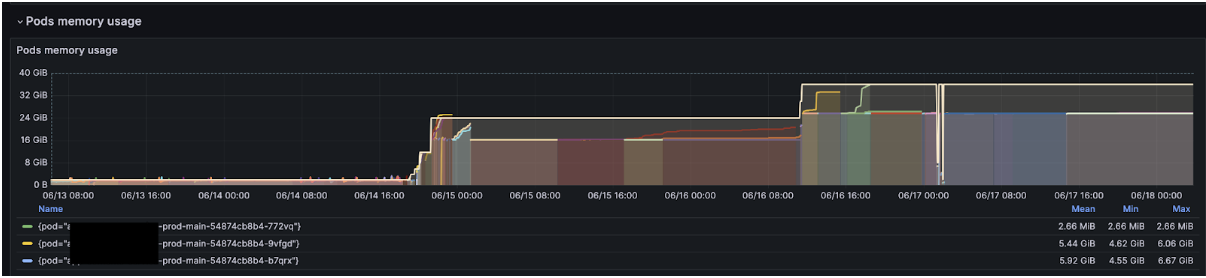
Screenshot 2: Memory climbs right after enabling the flags
Day 2 — The Red Herring Cache
The dev team pinged:
"We did merge an in-memory cache last week. Could that be it?"
Sounded plausible. To stay safe in peak hours, I cranked pod limits to 48 GiB. Yes, forty-eight. It felt wrong, but business comes first.
Memory kept climbing. Even after the cache was ripped out, nothing changed. Somewhere, my wallet whimpered.
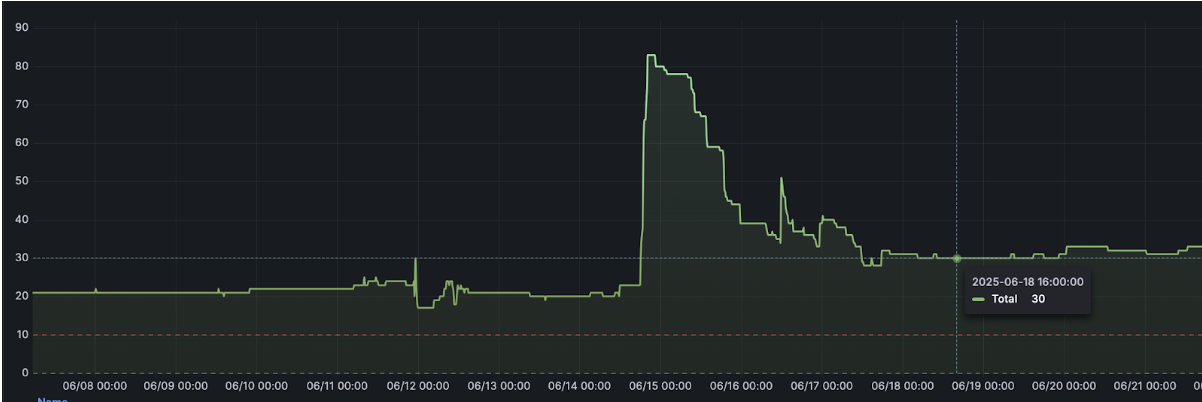
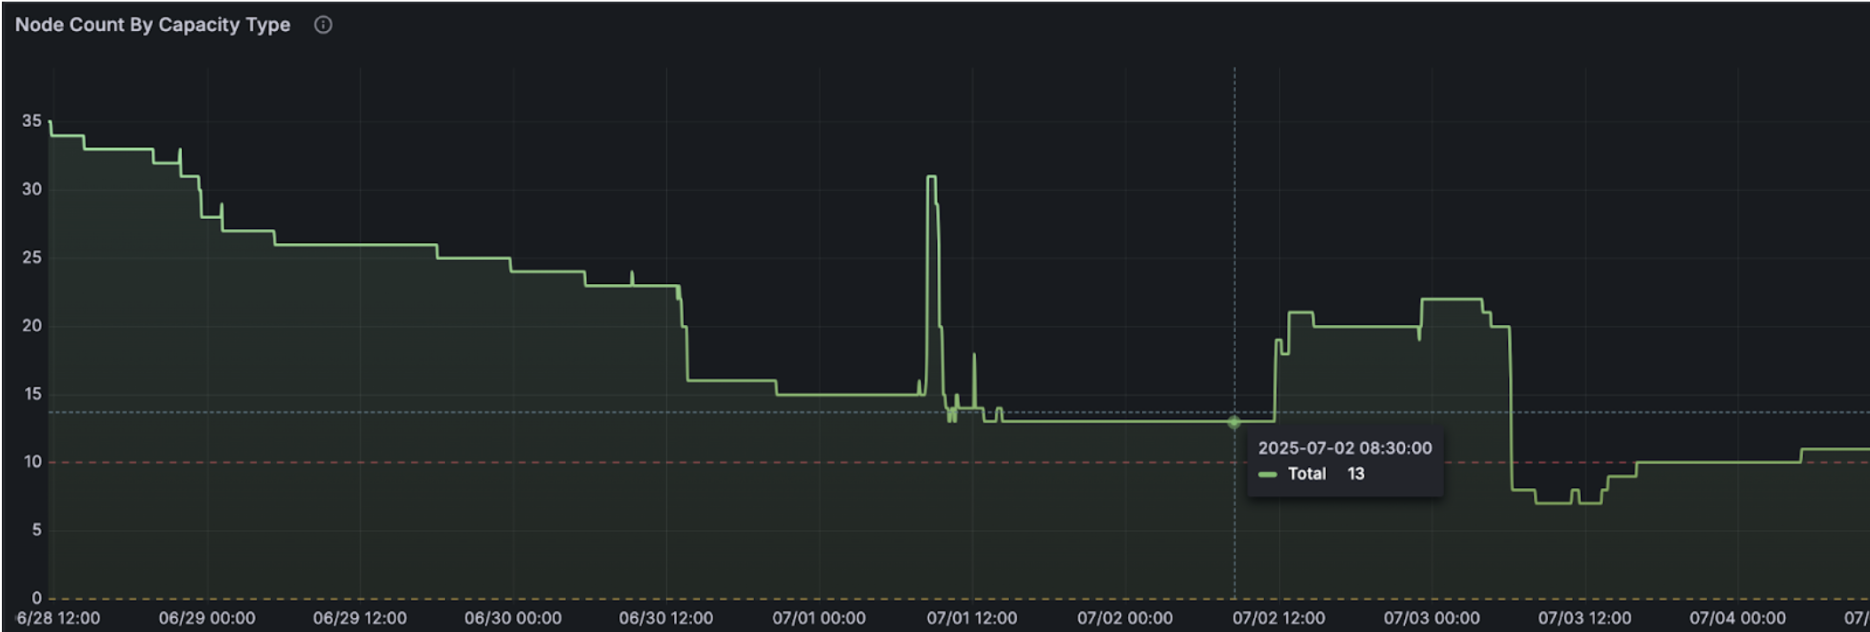
Screenshot 3: Node Count spike after node autoscaling
Day 3 — Watching a Heap Breathe
Time to break out the heavy tools. I attached JProfiler to a single pod late at night and watched the heap build mountains: 2 GiB… 25 GiB… boom—GC—back to 2 GiB. One giant cliff every minute. It was oddly hypnotic, like tides on fast-forward.
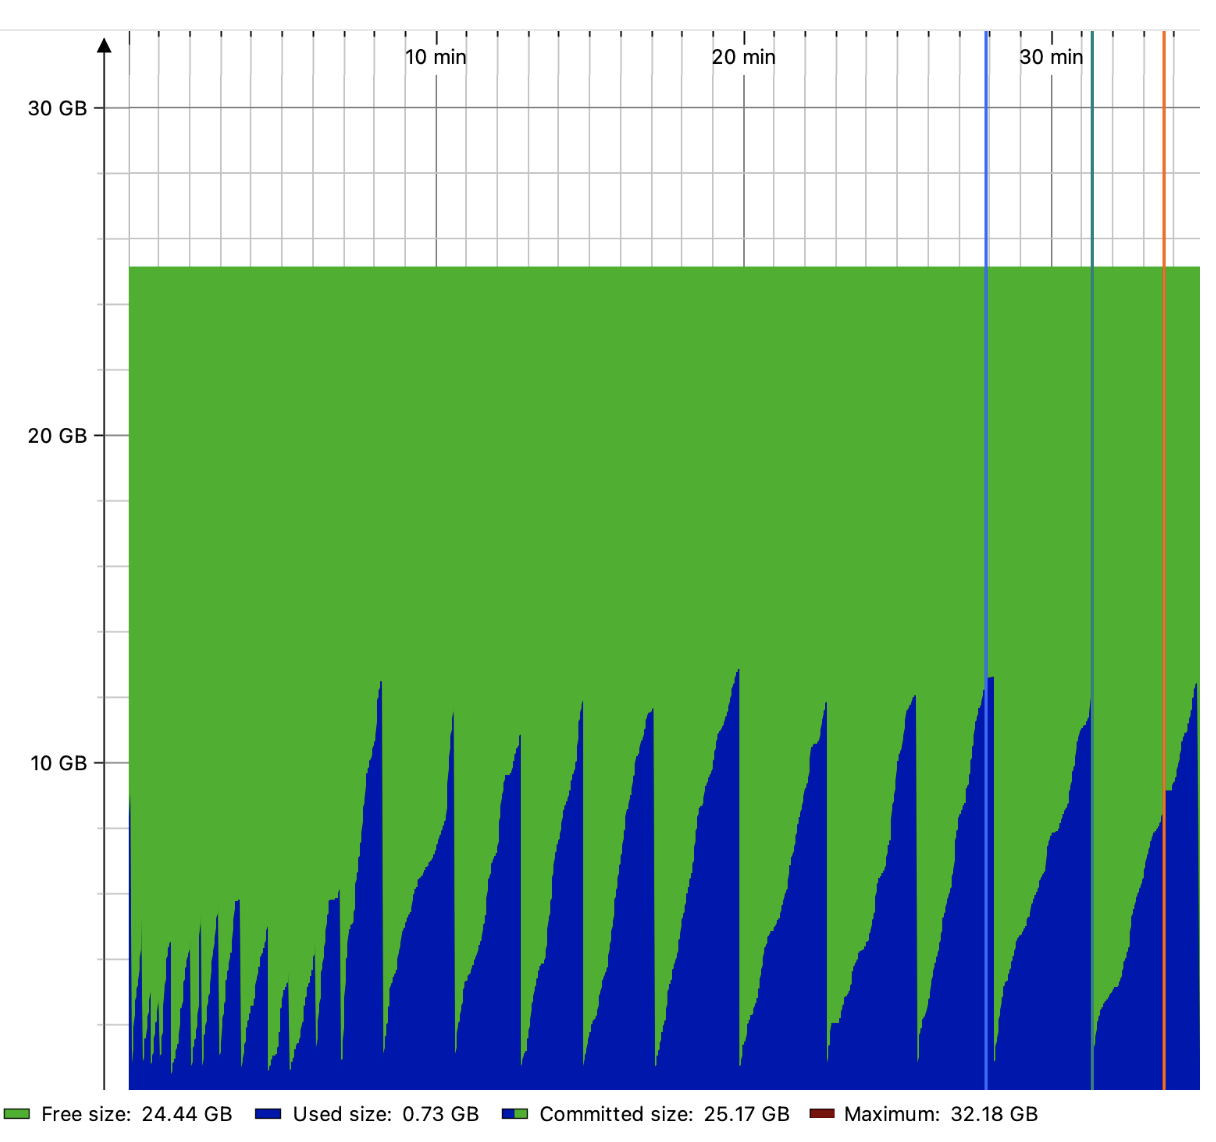
Screenshot 4: JProfiler "saw-tooth" heap graph
The garbage collector was leisurely—just one major sweep per minute. Plenty of time for the heap to swallow whole nodes.
Day 4 — The Footnote I Skipped
I reread the JVM docs, this time slowly. A single line felt like it was written in neon:
"Percentages are calculated from the container's memory limit, not its request."
I slapped my forehead. Of course!
75% of 8 GiB = 6 GiB heap—not the 3 GiB I expected.
After my panicked scale-up, 75% of 48 GiB = 36 GiB heap.
The JVM was only following orders. Bad orders.
Day 5 — Canary Courage
I rolled out a brave little canary pod:
resources:

  requests:

    cpu: 600m

    memory: 4Gi

  limits:

    cpu: 2000m

    memory: 6Gi
and tweaked the flags:
-XX:+UseContainerSupport

-XX:MaxRAMPercentage=50.0

-XX:InitialRAMPercentage=40.0
Then I watched. An hour passed. Heap steady at ~3 GiB. Two hours. Still steady. Latency? Identical to the chunky siblings. I left the office that night with cautious optimism.
Latency with Updated Config
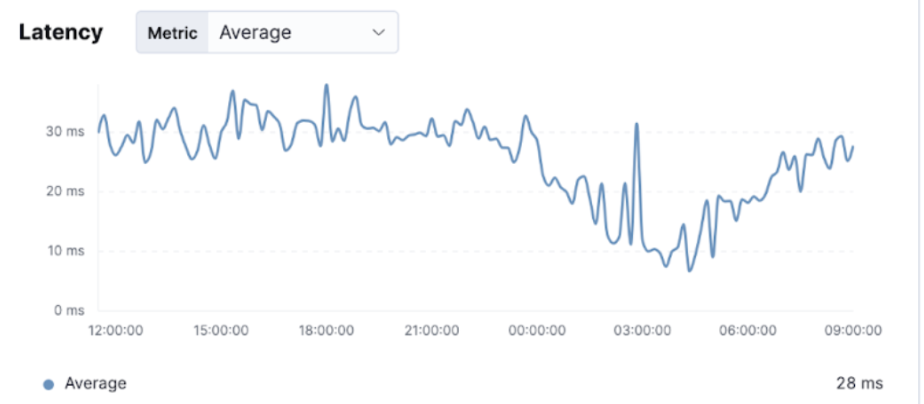
Screenshot 5a: Latency with updated config
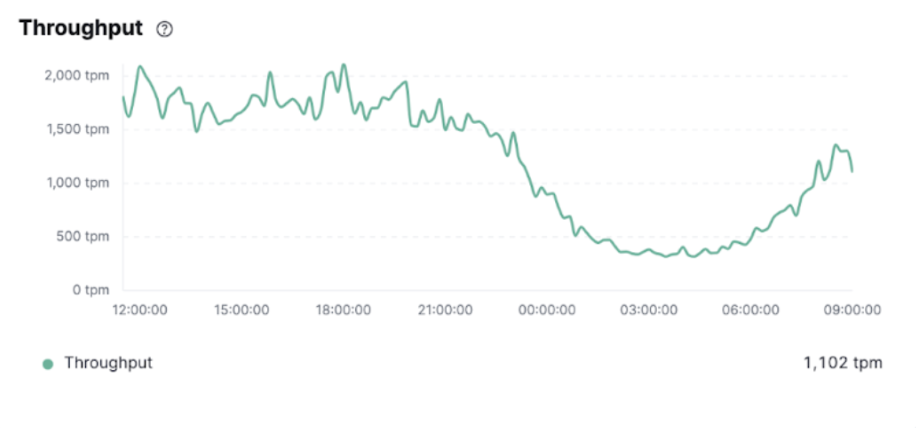
Screenshot 5b: Latency with updated config
Latency with Old Config
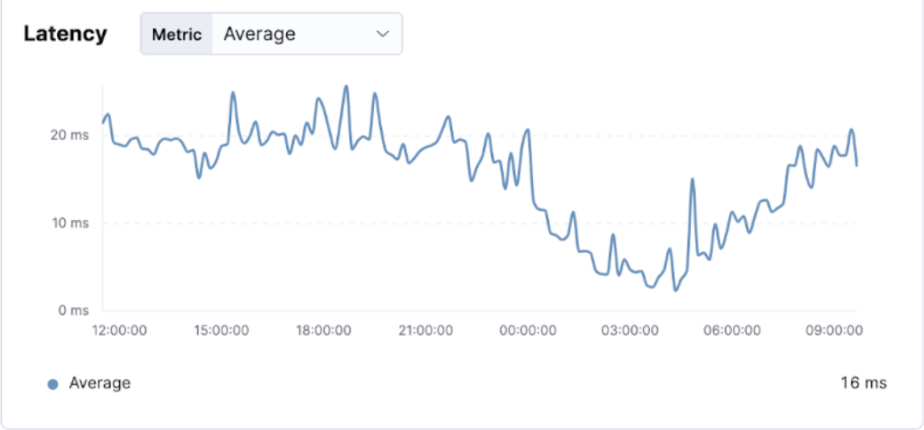
Screenshot 5c: Latency with old config
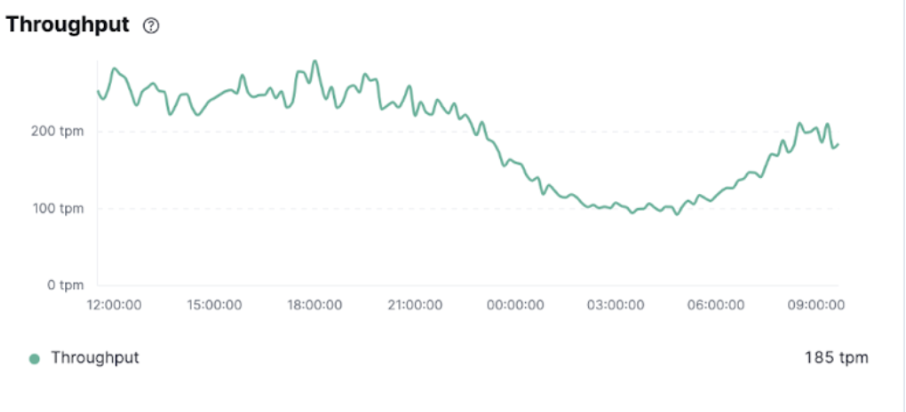
Screenshot 5d: Latency with old config
Day 6 — Victory Lap
Twenty-four hours later, still no hiccups. We flipped traffic: 10% → 50% → 100%. Cluster nodes idled; AWS billing dropped like a stone. The finance team bought donuts.
Before (48 GiB limit)
- Avg. Heap: 18 – 25 GiB
- GC pauses: 1/min, long
- Daily Cost: $X
After (6 GiB limit)
- Avg. Heap: 1.8 – 3.2 GiB
- GC pauses: 10/min, tiny
- Daily Cost: $X × 0.15
Screenshot 6: Node Count "cliff" after rollout
Epilogue — Lessons I Won't Forget
- Read the footnotes. Percent-based JVM flags use limits, not requests.
- Scaling up first and asking questions later burns money fast.
- A single canary pod can save thousands of dollars.
If this tale feels familiar, that's because every engineer has a version of it. May yours cost less.